Measuring Fitness and Training Stress
Successful events, come from successful training, you need to train to increase your fitness, constantly creating stimulus on your body to build bigger muscles, more efficient engines and everything it takes, but not so much stimulus that your body is so damaged it takes a long time to rebuild, or you get into a chronic fatigue situation. At the same time your body is incredibly lazy, and if you don't work it more than its current level, it just sits there content that it's fit enough for the demands.
So the goal is to balance increasing the good stress that builds fitness, but limits the bad stress that stops you training, and maybe even worse knocks you out for months. There's also another side of successful events, that of being not so fatigued from the recent training that you're literally too tired out and damaged to do well. Essentially, this is often expressed as
Form = Fitness - Fatigue.
So how do you manage this? Lots of ways, but the geeky way is to evaluate each workout as to how much fatigue it caused you and how much fitness it will reward you with in the future, and then average out all the workouts to come out with some numbers which tell you your form, your fatigue and your fitness.
Training is essentially a mix of frequency, intensity and duration, but how do you compare different workouts - say five 1 mile repeats at a high intensity, a 10 mile tempo run, or an easier 15miles. Which was harder, which was more useful training, does it even make sense to compare them? I think it does, and if not, you couldn't evaluate more than one session anyway, so we're going to give each workout a score.
Measuring duration sounds pretty easy - you need a watch. The only question becomes what to do with time when you stop, should the time you spend stopped be counted as part of a workout.
 You can of course have different HR zones for Cycling and running, or indeed any other sport. Once your HR zones are set up, you also need to set up the factors in Training Load to reflect the different intensities. Again here are mine:
 The important fact is that the values get progressively bigger as the HR values get larger, so 1 minute at a high HR contributes more to your score than 1 minute at a lower HR. My values for running are different:
 They're all higher, this is because for me, running causes considerably more stress, it hurts the muscles more etc, so I want it to contribute a higher value to the ATL than otherwise.
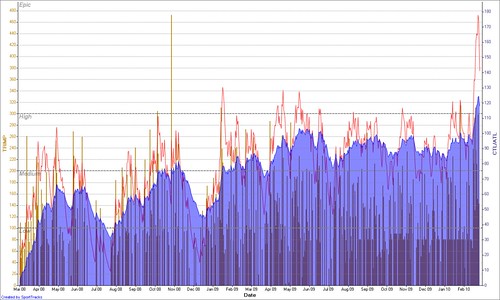 As you can see from the graph, which is my training between March 2008 and March 2010, pretty much when I returned to training as a slow, overweight, average mid 30's geek. The blue shaded area is my CTL, as you can see it rose gradually into the 60's, declined throughout the summer and then rose again as I trained for a marathon - the large bar showing a large TSS in Nov 2008. You can see the taper before the marathon as the red line - showing ATL - drops below the blue immediately before the event.
2009 was much more up and down, as I aimlessly cycle raced, but maintained a general higher fitness (ie more training!) than I did in 2008, and at the end of the graph I'm extremely fatigued with a high CTL - from 10 days and 41 hours of training in Lanzarote.
You can use the CTL and TSB to predict performance, you're likely to do very well when your TSB is near 0, it may be that you do best with a little -ve or a little +ve. People are different, and events are different, many people find with intense events a small -ve TSB is advantageous.
As you can see from the graph, which is my training between March 2008 and March 2010, pretty much when I returned to training as a slow, overweight, average mid 30's geek. The blue shaded area is my CTL, as you can see it rose gradually into the 60's, declined throughout the summer and then rose again as I trained for a marathon - the large bar showing a large TSS in Nov 2008. You can see the taper before the marathon as the red line - showing ATL - drops below the blue immediately before the event.
2009 was much more up and down, as I aimlessly cycle raced, but maintained a general higher fitness (ie more training!) than I did in 2008, and at the end of the graph I'm extremely fatigued with a high CTL - from 10 days and 41 hours of training in Lanzarote.
You can use the CTL and TSB to predict performance, you're likely to do very well when your TSB is near 0, it may be that you do best with a little -ve or a little +ve. People are different, and events are different, many people find with intense events a small -ve TSB is advantageous.
 This clearly shows running is pretty much a winter sport for me (although the big rise in October 2009 was actually in Hawaii when I didn't have a bike) and my Sport Specific CTL in running is tiny during the summer, I barely run once or twice a month.
This just means, whilst you can use overall ATL as a good guide for if you're overtrained, or undertrained etc. It doesn't remove you of the need to keep your workouts relevant to your event. It also means you probably want to track different sports seperately too.
This clearly shows running is pretty much a winter sport for me (although the big rise in October 2009 was actually in Hawaii when I didn't have a bike) and my Sport Specific CTL in running is tiny during the summer, I barely run once or twice a month.
This just means, whilst you can use overall ATL as a good guide for if you're overtrained, or undertrained etc. It doesn't remove you of the need to keep your workouts relevant to your event. It also means you probably want to track different sports seperately too.
Measuring Intensity
Intensity is harder, and measuring intensity is the fundamental problem of scoring a workout. For cycling, if you have a power meter, you can measure intensity pretty directly by the power you produce, this is how Training Peaks and WKO+ does it, using the ratio of the Normalized Power for the ride to your FTP to get your "intensity factor" to produce the Training Stress Score (IF^2 * duration). For running, on flat, consistent ground, pace is a very good measure of intensity, and WKO+ / Training Peaks again uses this, however it attempts to deal with hills by creating a "Normalized Graded Pace" for your run as if it was on flat ground. And uses this pace relative to your Threshold pace for creating the intensity factor (plus a 10% extra because it's a run...) The big problem with this is ground surface, running in mud, track or tarmac is completely different and using pace has no way to address this, so it'll never give you good results for cross country running or if you don't have accurate elevation data for your runs. If you run similar surfaces and roads it does a good job though. For both running and cycling heart rate shows a strong correlation with intensity, it can be depressed or elevated for various reasons, it falls down particularly at discerning between near maximal efforts, but there's still a strong correlation. Heart Rate response is not linear though - progressively more stress is done at the higher heart rates than at the lower ones, so you need to scale the intensity with the effort. This has been called training impulse or TRIMP The scaling is generally designed to mirror the blood lactate response of a person (the WKO Power model is similarly designed, being inspired by this TRIMP model.) One problem with the Power and Pace model of intensity is that it's highly dependant on accurate determination of your threshold power and pace, which are volatile targets, hopefully improving considerably as you train, so you can end up with inflated scores before you realise your thresholds have changed. In established athletes with pretty stable values this is less of a problem, in less trained people improving rapidly it's more of a problem. There's also a problem with cycling that your threshold is actually a bit of a moving target, different courses can make a difference - a 1 hour hill climb will generally produce higher watts than a 1 hour flat ride, which FTP do you use? Because I can't use running pace, I run on too wide a variety of surfaces even within a ride and without accurate elevation data for even my regular routes. And because I want to use a single measure I use the TRIMP model for everything, although I always look closely at how the Power based model compares when I cycle with my power meter. In all but a few cases it's near enough identical, in the few cases it's not there's often a reason I understand and I can choose to override a score or not - but the power one is as often out as the HR one it seems - I'll visit a full analysis of this in a later post.CTL, ATL and TSB
Once you have your score for an individual session, you need to mix them together to track your Fitness, and your Fatigue. Your fitness is simply all your workouts for a recent time combined together to create a score for today, your fatigue is the same. The difference being the time period that you measure for. To combine the workouts, rather than a simple average it's a weighted average so that the more recent training is worth more than older training. ie the fatigue caused by yesterdays workout is more than last weeks workout. The fatigue - the average of your recent Training Scores, is called your ATL (Acute Training Load), and typically set up to respond to the previous 5-15 days of training. The fitness - the average of your longer Training Scores, is called your CTL (Chronic Training Load), and typically set up to respond to the previous 6 weeks of training. The form - the difference between your Fitness and your Fatigue, is called your TSB (Training Stress Balance) and is simply the difference between your CTL and ATL. When your ATL is higher than your CTL, you're likely fatigued, and the larger negative the TSB is the more fatigued you are. When it's positive you're likely in good form. However, if it's largely positive, that can only have happened if you've severely reduced or stopped your training, so whilst you may be very un-fatigued, you'll also not be very fit.Automating the calculation
Raceday and WKO track this based on power and pace for running and cycling, Golden Cheetah does it for cycling using power (or HR in the very latest build), and the general principles are the same as below, but as I'm advocating Heart Rate, I'm going to talk about what I use the Training Load Plugin in SportTracks. It will use Power like the others, but by default it uses Heart Rate. Because it uses HR, you need to configure it. First you need to ensure that you have your HR zones configured and they are reasonably right for you, the ST forum has a little info on this. Personally, I use 6 zones, zone 0 for essentially resting, HR below 103, and a classic 5 Zone system, but you can do whatever you want, so long as the zones reasonably match your HR profile.
You can of course have different HR zones for Cycling and running, or indeed any other sport. Once your HR zones are set up, you also need to set up the factors in Training Load to reflect the different intensities. Again here are mine:
The important fact is that the values get progressively bigger as the HR values get larger, so 1 minute at a high HR contributes more to your score than 1 minute at a lower HR. My values for running are different:
They're all higher, this is because for me, running causes considerably more stress, it hurts the muscles more etc, so I want it to contribute a higher value to the ATL than otherwise.
The result, the shiny graphs
The result is some graphs, showing how your training load has changed over the past (click for larger view) As you can see from the graph, which is my training between March 2008 and March 2010, pretty much when I returned to training as a slow, overweight, average mid 30's geek. The blue shaded area is my CTL, as you can see it rose gradually into the 60's, declined throughout the summer and then rose again as I trained for a marathon - the large bar showing a large TSS in Nov 2008. You can see the taper before the marathon as the red line - showing ATL - drops below the blue immediately before the event.
2009 was much more up and down, as I aimlessly cycle raced, but maintained a general higher fitness (ie more training!) than I did in 2008, and at the end of the graph I'm extremely fatigued with a high CTL - from 10 days and 41 hours of training in Lanzarote.
You can use the CTL and TSB to predict performance, you're likely to do very well when your TSB is near 0, it may be that you do best with a little -ve or a little +ve. People are different, and events are different, many people find with intense events a small -ve TSB is advantageous.
As you can see from the graph, which is my training between March 2008 and March 2010, pretty much when I returned to training as a slow, overweight, average mid 30's geek. The blue shaded area is my CTL, as you can see it rose gradually into the 60's, declined throughout the summer and then rose again as I trained for a marathon - the large bar showing a large TSS in Nov 2008. You can see the taper before the marathon as the red line - showing ATL - drops below the blue immediately before the event.
2009 was much more up and down, as I aimlessly cycle raced, but maintained a general higher fitness (ie more training!) than I did in 2008, and at the end of the graph I'm extremely fatigued with a high CTL - from 10 days and 41 hours of training in Lanzarote.
You can use the CTL and TSB to predict performance, you're likely to do very well when your TSB is near 0, it may be that you do best with a little -ve or a little +ve. People are different, and events are different, many people find with intense events a small -ve TSB is advantageous.
The Problem of Specificity
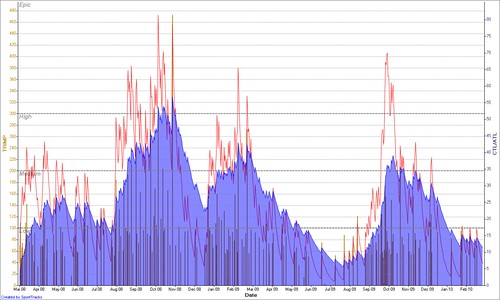
All training isn't equal of course, and CTL/ATL and TSB, is only relevant if the training is appropriate to your event, or specific as it's commonly known. If you look at my graph above and look at the high training load I had in June, you'd think I could've run a good strong 10km race. However, I couldn't, and if you look again just for running, you'll see why. This clearly shows running is pretty much a winter sport for me (although the big rise in October 2009 was actually in Hawaii when I didn't have a bike) and my Sport Specific CTL in running is tiny during the summer, I barely run once or twice a month.
This just means, whilst you can use overall ATL as a good guide for if you're overtrained, or undertrained etc. It doesn't remove you of the need to keep your workouts relevant to your event. It also means you probably want to track different sports seperately too.
This clearly shows running is pretty much a winter sport for me (although the big rise in October 2009 was actually in Hawaii when I didn't have a bike) and my Sport Specific CTL in running is tiny during the summer, I barely run once or twice a month.
This just means, whilst you can use overall ATL as a good guide for if you're overtrained, or undertrained etc. It doesn't remove you of the need to keep your workouts relevant to your event. It also means you probably want to track different sports seperately too.
Thu Nov 7 09:03:06 UTC 2013 [...] PMC? TSS? ATL? CTL? TSB? That’s a lot of TLAs! But there are lots of athletes and coaches taking advantage of the picture that the Performance Management Chart gives you, and plenty of posts about it online. Coach Cox has lots, and his Analytical Triathlon Training article is a good place to start. I also like Jim Ley’s blog post on measuring fitness and training stress. DC Rainmaker uses TP too, so it must be good. This entry was posted in Uncategorized and tagged TrainingPeaks by garethsb. Bookmark the permalink. [...]